
Automating EDA - Better Summaries from Pandas
The first thing that many of us do to quickly inspect a dataframe containing a fresh dataset is to use the
df.describe() method. This works well to quickly get an idea of the size and distribution of the
numerical columns
in the dataframe but often needs to be supplemented with additional code to check for outliers, correlations, or to
look at any
of the non-numerical data stored in the dataframe.
A while ago I discovered the package pandas-profiling while browsing r/datascience and quickly realised
I could perform a lot of basic exploratory analysis in less then 3 lines of code. In this post I will describe the
key features of the package and
how to use it.
Jupyter and Virtual Environments
I start off every new project by creating a new virtual environment and by creating a new kernel for my notebooks.
	$ virtualenv venv
	$ source venv/bin/activate
	$ pip install ipython
	$ ipython kernel install --user --name=pandas-profiling
For the purposes of this tutorial, I will be using the Titanic dataset to highlight the features available within pandas-profiling. This can be downloaded with
$ curl https://web.stanford.edu/class/archive/cs/cs109/cs109.1166/stuff/titanic.csv -o titanic.csv
I then installed the necessary packages before launching a notebook
	$ virtualenv venv
	$ source venv/bin/activate
	$ pip install ipython
	$ ipython kernel install --user --name=pandas-profiling

	$ jupyter notebook
Pandas Profiling
After reading in your data into a dataframe, you can quickly build a report with
	import pandas as pd
	import pandas_profiling
	df = pd.read_csv('./titanic.csv')
	profile = df.profile_report()
	profile
This outputs the report into a Jupyter cell. Since notebooks run in the browser, you can also easily export the report as a HTML file. Check out the full report - I will go through and describe the different sections below.
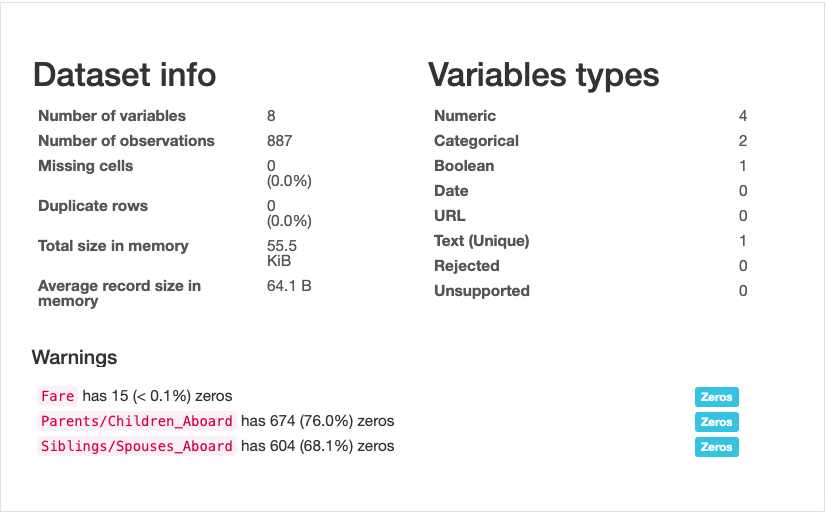
Overview
There are 5 main sections of the report. The first section is an overview of the dataset as a whole, giving you things like the number of samples, number of variables, variable types, and the size of data on the disk. There is also a subsection that highlights to the user some potential warnings such as columns with many zeroes, with a lot of missing data, duplicate records, or with many distinct values.
Variables
The second section goes through each of the columns, or variables, in the dataframe and provides summaries such as the mean, median, missing values, and a plot of the distribution.
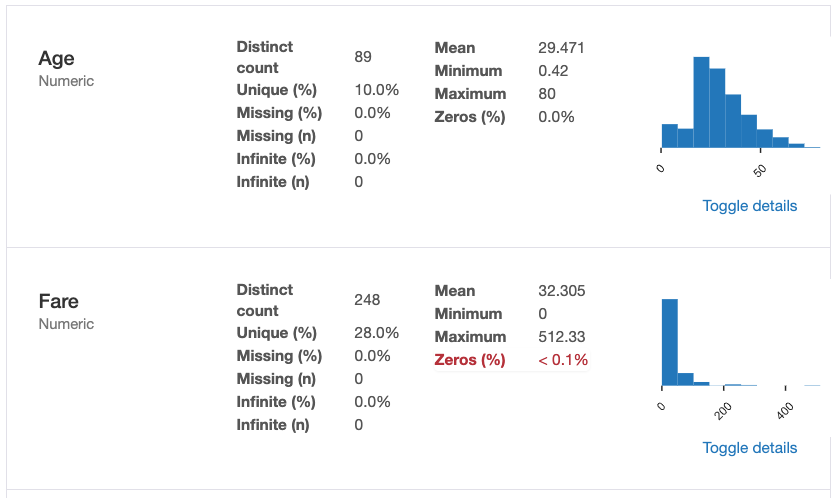
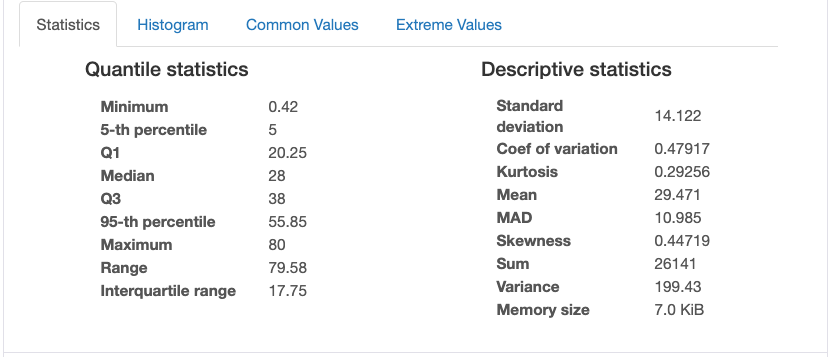
A toggle allows the user to explore this variable in more depth giving you information on variance, measures of skew, and quartile information.
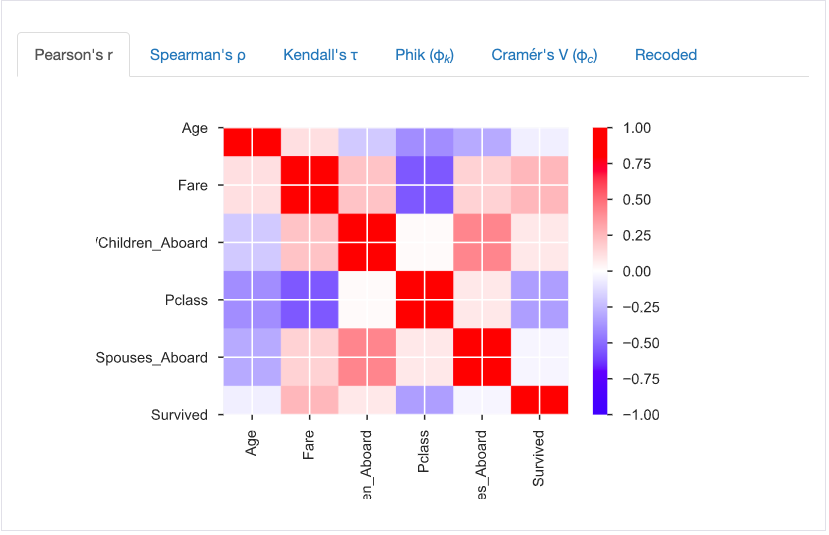
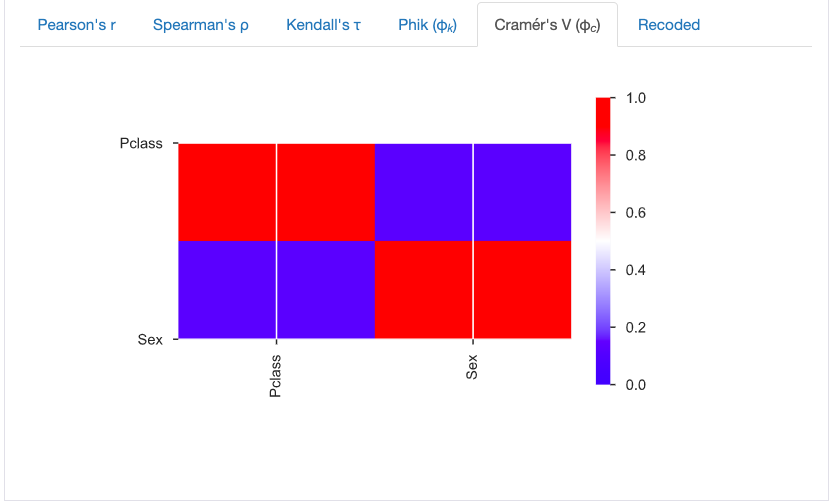
Correlations
The third section gives information on the pairwise correlations of two columns. There are several measures including Person's r, Spearman's ρ, and for categorical columns there Cramér's V.
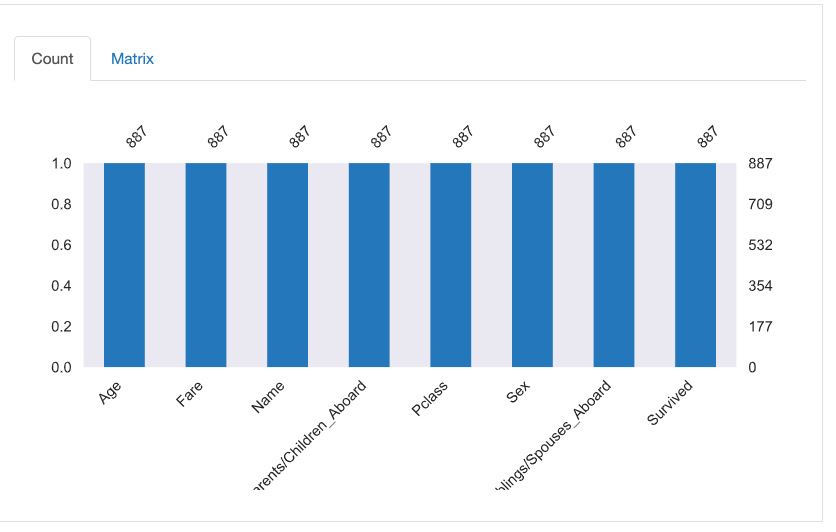
Missing Values
The final plot, and the penultimate section, is where you would the information on missing values and is presented in the form of a bar graph.
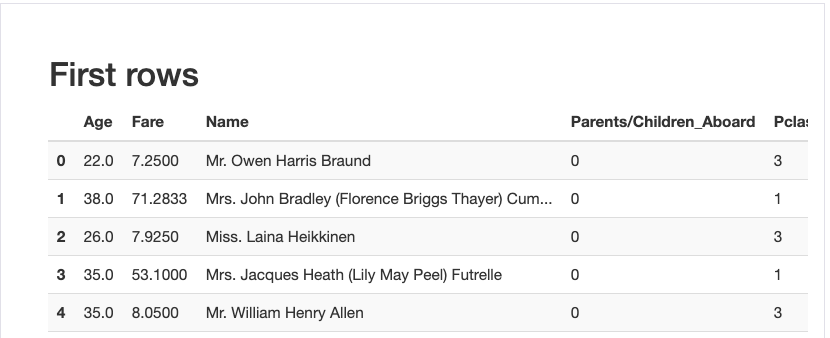
Sample
The last section gives two samples of the data, taken from the top and bottom of the dataset. These are equivalent
to the
df.head() and df.tail() methods.
Summary
This tool has sped up a lot of my initial EDA work and presents the results in a nice and concise format to boot - would recommend!